Session 8 — Monte Carlo Dropout: Implementation 🏥
Turning a familiar regularization technique into a practical tool for uncertainty estimation.
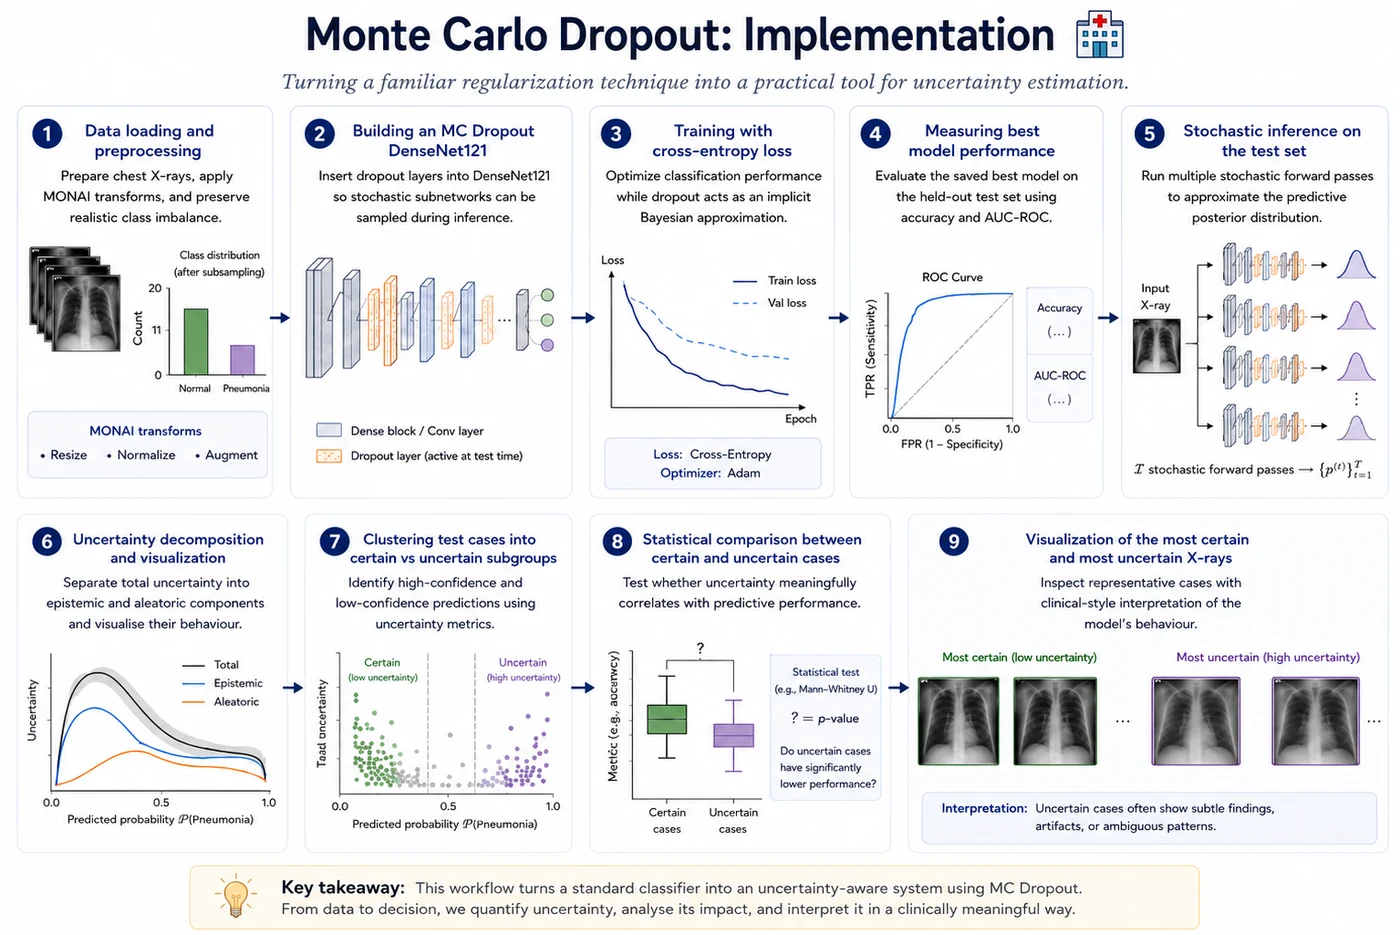
🎯 What this notebook does
We take the concepts from the teaching notebook and apply them to a real binary classification task: normal vs pneumonia chest X-rays. The notebook walks through the full Bayesian deep learning pipeline step by step:
- Data loading and preprocessing — prepare chest X-rays, apply MONAI transforms, and preserve realistic class imbalance through controlled subsampling
- Building an MC Dropout DenseNet121 — insert dropout layers into DenseNet121 so stochastic subnetworks can be sampled during inference
- Training with cross-entropy loss — optimize classification performance while dropout acts as an implicit Bayesian approximation
- Measuring best model performance — evaluate the saved best model on the held-out test set using accuracy and AUC-ROC
- Stochastic inference on the test set — run multiple stochastic forward passes to approximate the predictive posterior distribution
- Uncertainty decomposition and visualization — separate total uncertainty into epistemic and aleatoric components and visualise their behaviour
- Clustering test cases into certain vs uncertain subgroups — identify high-confidence and low-confidence predictions using uncertainty metrics
- Statistical comparison between certain and uncertain cases — test whether uncertainty meaningfully correlates with predictive performance
- Visualization of the most certain and most uncertain chest X-rays — inspect representative cases with clinical-style interpretation of the model’s behaviour
💡 Key difference from Session 5
In VI we changed the model (BayesLinear head) and the loss (ELBO).
In MC Dropout we change neither — only what we do at inference time. The model trains exactly like a standard DenseNet121. The uncertainty comes entirely from keeping dropout active during prediction.
📦 Part 1 — Installs and imports
!pip install -q monai torch-uncertainty lightning

import os, random, glob
import numpy as np
import pandas as pd
import matplotlib.pyplot as plt
import matplotlib.patches as mpatches
from PIL import Image
from tqdm import tqdm

import torch
import torch.nn as nn
import torch.optim as optim

from scipy import stats
from statsmodels.stats.proportion import proportions_ztest
from sklearn.metrics import roc_auc_score, accuracy_score, confusion_matrix, classification_report
from sklearn.mixture import GaussianMixture

# MONAI
from monai.transforms import (
    Compose, LoadImaged, EnsureChannelFirstd, RepeatChanneld,
    ScaleIntensityd, Resized, RandFlipd, RandRotated, EnsureTyped,
)
from monai.data import Dataset, DataLoader
from monai.networks.nets import DenseNet121

# Torch-Uncertainty
from torch_uncertainty.layers.bayesian import BayesLinear
from torch_uncertainty.losses import ELBOLoss
from torch_uncertainty.metrics.classification import CalibrationError, AURC

# Reproducibility
SEED = 42
random.seed(SEED)
np.random.seed(SEED)
torch.manual_seed(SEED)
torch.cuda.manual_seed_all(SEED)

device = torch.device('cuda' if torch.cuda.is_available() else 'cpu')
print(f'Device: {device}')
🗂️ Part 2 — Data preparation
Identical to Session 5 — same dataset, same ratios, same splits. This is intentional: any difference in results between sessions is purely due to the algorithm, not the data.
DATA_DIR = "/kaggle/input/datasets/paultimothymooney/chest-xray-pneumonia/chest_xray"

def is_grayscale(path):
    try:
        return Image.open(path).mode in ['L', 'I;16', 'I']
    except:
        return False

def make_split_list_filtered(split_dir):
    normal_files = sorted(glob.glob(os.path.join(split_dir, 'NORMAL', '*')))
    pneu_files   = sorted(glob.glob(os.path.join(split_dir, 'PNEUMONIA', '*')))
    normal_files = [f for f in normal_files if is_grayscale(f)]
    pneu_files   = [f for f in pneu_files   if is_grayscale(f)]
    return ([{'image': f, 'label': 0} for f in normal_files] +
            [{'image': f, 'label': 1} for f in pneu_files])

def subsample_with_ratio(files, n_total, normal_pneu_ratio, seed=42):

    rng    = np.random.default_rng(seed)
    normal = [d for d in files if int(d['label']) == 0]
    pneu   = [d for d in files if int(d['label']) == 1]
    rng.shuffle(normal)
    rng.shuffle(pneu)

    n_pneu   = int(round(n_total / (1 + normal_pneu_ratio)))
    n_normal = n_total - n_pneu

    n_normal = min(n_normal, len(normal))
    n_pneu   = min(n_pneu,   len(pneu))

    subset = normal[:n_normal] + pneu[:n_pneu]
    rng.shuffle(subset)

    actual = n_normal / n_pneu if n_pneu > 0 else float('inf')
    print(f'  NORMAL={n_normal}, PNEUMONIA={n_pneu}, '
          f'total={len(subset)}')
    return subset

train_files_all = make_split_list_filtered(os.path.join(DATA_DIR, 'train'))
val_files_all   = make_split_list_filtered(os.path.join(DATA_DIR, 'val'))
test_files_all  = make_split_list_filtered(os.path.join(DATA_DIR, 'test'))

print('Train subset (normal:pneu = 2.7:1):')
train_files = subsample_with_ratio(train_files_all, n_total=1000,
                                    normal_pneu_ratio=2.7, seed=SEED)
print('Test subset (normal:pneu = 1.7:1):')
test_files  = subsample_with_ratio(test_files_all,  n_total=100,
                                    normal_pneu_ratio=1.7, seed=SEED)
print(f'Val (full): {len(val_files_all)} samples')
IMG_SIZE   = 224
BATCH_SIZE = 32

train_tfms = Compose([
    LoadImaged(keys=['image']),
    EnsureChannelFirstd(keys=['image']),
    RepeatChanneld(keys=['image'], repeats=3),
    ScaleIntensityd(keys=['image']),
    Resized(keys=['image'], spatial_size=(IMG_SIZE, IMG_SIZE)),
    RandFlipd(keys=['image'], prob=0.5, spatial_axis=1),
    RandRotated(keys=['image'], prob=0.3, range_x=0.12),
    EnsureTyped(keys=['image', 'label']),
])
eval_tfms = Compose([
    LoadImaged(keys=['image']),
    EnsureChannelFirstd(keys=['image']),
    RepeatChanneld(keys=['image'], repeats=3),
    ScaleIntensityd(keys=['image']),
    Resized(keys=['image'], spatial_size=(IMG_SIZE, IMG_SIZE)),
    EnsureTyped(keys=['image', 'label']),
])

train_ds = Dataset(data=train_files,   transform=train_tfms)
val_ds   = Dataset(data=val_files_all, transform=eval_tfms)
test_ds  = Dataset(data=test_files,    transform=eval_tfms)

train_loader = DataLoader(train_ds, batch_size=BATCH_SIZE, shuffle=True,
                           num_workers=2, pin_memory=True)
val_loader   = DataLoader(val_ds,   batch_size=BATCH_SIZE, shuffle=False,
                           num_workers=2, pin_memory=True)
test_loader  = DataLoader(test_ds,  batch_size=BATCH_SIZE, shuffle=False,
                           num_workers=2, pin_memory=True)

print(f'Train batches: {len(train_loader)}')
print(f'Val batches  : {len(val_loader)}')
print(f'Test batches : {len(test_loader)}')
# Visualizing one case per class

def get_one_per_class(ds):
    normal_sample = None
    pneumonia_sample = None

    for i in range(len(ds)):
        sample = ds[i]
        y = int(sample["label"])
        if y == 0 and normal_sample is None:
            normal_sample = sample
        elif y == 1 and pneumonia_sample is None:
            pneumonia_sample = sample
        if normal_sample is not None and pneumonia_sample is not None:
            break
    return normal_sample, pneumonia_sample


def to_rgb_for_display(x):
    # x: [C,H,W]
    if x.shape[0] > 3:
        x = x[:3]
    elif x.shape[0] == 1:
        x = x.repeat(3, 1, 1)

    img = x.permute(2, 1, 0).cpu().numpy()
    img = np.clip(img, 0, 1)
    return img


def show_normal_and_pneumonia(ds):
    normal_sample, pneumonia_sample = get_one_per_class(ds)

    plt.figure(figsize=(10, 5))
    for i, sample in enumerate([normal_sample, pneumonia_sample], 1):
        x = sample["image"]
        y = int(sample["label"])
        plt.subplot(1, 2, i)
        plt.imshow(to_rgb_for_display(x))
        plt.title("NORMAL" if y == 0 else "PNEUMONIA")
        plt.axis("off")
    plt.tight_layout()
    plt.show()

show_normal_and_pneumonia(train_ds)

🧠 Part 3 — Building the MC Dropout model
This is where MC Dropout looks completely different from VI in code.
In Session 5 we:
- Replaced
nn.LinearwithBayesLinear← model change - Used
ELBOLoss← loss change
Here we do neither. The model is a standard DenseNet121 with one nn.Dropout layer added before the classifier. The loss is plain cross-entropy. The only thing that changes is what we do at inference time.
⚠️ The BatchNorm problem — and how we fix it
When you call model.eval(), two things happen:
- BatchNorm switches to running statistics ✅ — this is what we want
- Dropout is disabled ❌ — this is what we do NOT want
The fix is enable_dropout() — a function that puts the model in eval() mode first (fixing BatchNorm), then manually re-enables only the dropout layers. This is the standard approach in MC Dropout implementations and it matters for getting clean uncertainty estimates.
DROPOUT_RATE = 0.3   # this is the rate we use for training AND inference

class MCDropoutDenseNet121(nn.Module):

    def __init__(self, num_classes=2, dropout_rate=DROPOUT_RATE,
                 freeze_backbone=True):
        super().__init__()

        backbone = DenseNet121(
            spatial_dims=2,
            in_channels=3,
            out_channels=num_classes,
            pretrained=True,
        )

        self.features = backbone.features
        self.pool     = nn.AdaptiveAvgPool2d((1, 1))

        # The only addition: a Dropout layer before the classifier
        # This is what produces stochastic predictions at inference time
        self.dropout    = nn.Dropout(p=dropout_rate)
        self.classifier = nn.Linear(1024, num_classes)

        if freeze_backbone:
            for param in self.features.parameters():
                param.requires_grad = False

    def forward(self, x):
        x = self.features(x)
        x = torch.relu(x)
        x = self.pool(x)
        x = torch.flatten(x, 1)   # [B, 1024]
        x = self.dropout(x)        # <-- stochastic at inference if enabled
        x = self.classifier(x)     # [B, 2]
        return x


def enable_dropout(model):
    """
    Put model in eval() mode (fixes BatchNorm) but re-enable Dropout layers.

    This is the standard MC Dropout inference setup.
    Without this, model.eval() would disable dropout and you'd get
    deterministic predictions — defeating the whole purpose.
    """
    model.eval()
    for module in model.modules():
        if isinstance(module, nn.Dropout):
            module.train()


model = MCDropoutDenseNet121(
    num_classes=2,
    dropout_rate=DROPOUT_RATE,
    freeze_backbone=True
).to(device)

total_params = sum(p.numel() for p in model.parameters())
trainable    = sum(p.numel() for p in model.parameters() if p.requires_grad)

print(f'Total parameters    : {total_params:,}')
print(f'Trainable parameters: {trainable:,}')
print()
print('Compare with Session 5 (VI):')
print('  VI trained 2x the head parameters (mu + sigma per weight)')
print('  MC Dropout trains the same number as a standard DenseNet121')
print('  No extra parameters. No ELBO. Just a Dropout layer.')
⚙️ Part 4 — Training
Training is completely standard — plain cross-entropy, plain Adam. There is no ELBO, no KL term, no reconstruction/regularization balance to manage.
This is one of the real practical advantages of MC Dropout: zero training overhead. If you already have a trained model with dropout, you can apply MC Dropout at inference time without retraining at all.
# Training setup

NUM_EPOCHS = 100
T_SAMPLES  = 20

EARLY_STOP_PATIENCE = 10
PLATEAU_PATIENCE    = 3
PLATEAU_FACTOR      = 0.5
MIN_LR              = 1e-6
BEST_PATH           = "/kaggle/working/best_model.pth"

# Standard CE loss
loss_fn = nn.CrossEntropyLoss()

# Only optimise trainable params
optimizer = optim.Adam(
    filter(lambda p: p.requires_grad, model.parameters()),
    lr=1e-3,
)

# Plateau scheduler
scheduler = optim.lr_scheduler.ReduceLROnPlateau(
    optimizer,
    mode='max',                 # because we monitor Val AUC
    factor=PLATEAU_FACTOR,
    patience=PLATEAU_PATIENCE,
    threshold=1e-3,
    threshold_mode='rel',
    min_lr=MIN_LR,
)

print(f'Epochs                : {NUM_EPOCHS}')
print(f'Early stop patience   : {EARLY_STOP_PATIENCE}')
print(f'LR plateau patience   : {PLATEAU_PATIENCE}')
print(f'LR reduction factor   : {PLATEAU_FACTOR}')
print(f'Min LR                : {MIN_LR}')
print(f'Best model path       : {BEST_PATH}')
# Training loop

history = {
    'train_loss': [],
    'val_loss': [],
    'val_acc': [],
    'val_auc': [],
    'lr': [],
}

best_val_loss = np.inf
early_stop_counter = 0

for epoch in range(1, NUM_EPOCHS + 1):

    # ─────────────────────────────────────────────────────────────────────────
    # TRAIN
    # ─────────────────────────────────────────────────────────────────────────

    model.train()

    epoch_loss = 0.0

    for batch in tqdm(
        train_loader,
        desc=f'Epoch {epoch:02d}/{NUM_EPOCHS}',
        leave=False
    ):

        images = batch['image'].to(device, dtype=torch.float32)

        labels = batch['label'].to(device, dtype=torch.long)

        optimizer.zero_grad()

        logits = model(images)

        loss = loss_fn(logits, labels)

        loss.backward()

        optimizer.step()

        epoch_loss += loss.item()

    avg_train_loss = epoch_loss / len(train_loader)

    # ─────────────────────────────────────────────────────────────────────────
    # VALIDATION
    # ─────────────────────────────────────────────────────────────────────────

    model.eval()

    val_loss = 0.0

    val_probs  = []
    val_preds  = []
    val_labels = []

    with torch.no_grad():

        for batch in val_loader:

            images = batch['image'].to(device, dtype=torch.float32)

            labels_tensor = batch['label'].to(device, dtype=torch.long)

            logits = model(images)

            loss = loss_fn(logits, labels_tensor)

            val_loss += loss.item()

            probs = torch.softmax(
                logits,
                dim=-1
            ).cpu().numpy()

            labels = labels_tensor.cpu().numpy()

            val_probs.extend(probs[:, 1].tolist())

            val_preds.extend(
                probs.argmax(axis=1).tolist()
            )

            val_labels.extend(labels.tolist())

    avg_val_loss = val_loss / len(val_loader)

    val_acc = accuracy_score(val_labels, val_preds)

    val_auc = roc_auc_score(val_labels, val_probs)

    # ─────────────────────────────────────────────────────────────────────────
    # Scheduler step
    # ─────────────────────────────────────────────────────────────────────────

    scheduler.step(avg_val_loss)

    current_lr = optimizer.param_groups[0]['lr']

    # ─────────────────────────────────────────────────────────────────────────
    # Save history
    # ─────────────────────────────────────────────────────────────────────────

    history['train_loss'].append(avg_train_loss)
    history['val_loss'].append(avg_val_loss)
    history['val_acc'].append(val_acc)
    history['val_auc'].append(val_auc)
    history['lr'].append(current_lr)

    # ─────────────────────────────────────────────────────────────────────────
    # Save best model
    # ─────────────────────────────────────────────────────────────────────────

    if avg_val_loss < best_val_loss:

        best_val_loss = avg_val_loss

        early_stop_counter = 0

        torch.save(model.state_dict(), BEST_PATH)

        print(f'✅ Saved best model (val_loss={best_val_loss:.4f})')

    else:

        early_stop_counter += 1

    # ─────────────────────────────────────────────────────────────────────────
    # Print progress
    # ─────────────────────────────────────────────────────────────────────────

    print(
        f'Epoch {epoch:02d}/{NUM_EPOCHS} | '
        f'Train Loss: {avg_train_loss:.4f} | '
        f'Val Loss: {avg_val_loss:.4f} | '
        f'Val Acc: {val_acc:.3f} | '
        f'Val AUC: {val_auc:.3f} | '
        f'LR: {current_lr:.6f}'
    )

    # ─────────────────────────────────────────────────────────────────────────
    # Early stopping
    # ─────────────────────────────────────────────────────────────────────────

    if early_stop_counter >= EARLY_STOP_PATIENCE:

        print('\n🛑 Early stopping triggered.')

        break

print('\nTraining complete ✅')
# Training curves
fig, axes = plt.subplots(1, 2, figsize=(14, 4))
fig.suptitle('MC Dropout DenseNet121 — Training curves', fontsize=13)

epochs = range(1, len(history['train_loss']) + 1)

plot_config = [
    ('train_loss', '#D85A30', 'Train Loss'),
    ('val_loss',   '#7F77DD', 'Val Loss')
]

for ax, (key, color, title) in zip(axes, plot_config):
    ax.plot(epochs, history[key], color=color, linewidth=2)
    ax.set_title(title)
    ax.set_xlabel('Epoch')
    ax.spines[['top', 'right']].set_visible(False)

plt.tight_layout()
plt.show()

# Loading the best model

model = MCDropoutDenseNet121(
    num_classes=2,
    dropout_rate=DROPOUT_RATE,
    freeze_backbone=True
).to(device)

# I renamed the best model to mcd_best_model.pth and added it to inputs

BEST_PATH = "/kaggle/input/models/benyamingheiji/mcd-best-model/pytorch/default/1/mcd_best_model.pth"

model.load_state_dict(torch.load(BEST_PATH, map_location=device))

model.eval()

with torch.no_grad():
    batch = next(iter(test_loader))
    images = batch['image'].to(device)

    logits = model(images)
    probs = torch.softmax(logits, dim=-1)

print("Loaded model works. Output shape:", probs.shape)
🔮 Part 5 — Stochastic inference
The inference procedure is very similar to VI — T forward passes, collect predictions, compute uncertainty. The key difference is what produces the stochasticity:
- VI: each forward pass samples different weights from $q_\phi(w)$
- MC Dropout: each forward pass applies a different random mask to the activations
def stochastic_inference_mcd(model, loader, T=20, device=device):

    enable_dropout(model)   # eval() + re-enable Dropout

    all_mean_preds, all_entropy, all_variance = [], [], []
    all_epistemic, all_aleatoric              = [], []
    all_labels, all_paths, all_images         = [], [], []

    with torch.no_grad():
        for batch in tqdm(loader, desc='MC Dropout inference'):
            images = batch['image'].to(device, dtype=torch.float32)
            labels = batch['label'].cpu().numpy()
            paths  = (batch.get('image_meta_dict', {}).get('filename_or_obj')
                      or [''] * len(labels))

            # T forward passes — different dropout mask each time
            sample_probs = []
            for _ in range(T):
                probs = torch.softmax(model(images), dim=-1).cpu().numpy()
                sample_probs.append(probs)

            sample_probs = np.stack(sample_probs, axis=0)  # [T, B, 2]
            mean_probs   = sample_probs.mean(axis=0)       # [B, 2]

            # ── Total uncertainty: predictive entropy of the mean ─────────────
            total_H = -np.sum(
                mean_probs * np.log(mean_probs + 1e-8), axis=-1
            )  # [B]

            # ── Aleatoric: expected entropy across T passes ───────────────────
            per_H       = -np.sum(
                sample_probs * np.log(sample_probs + 1e-8), axis=-1
            )  # [T, B]
            aleatoric_H = per_H.mean(axis=0)              # [B]

            # ── Epistemic: mutual information = total - aleatoric ─────────────
            epistemic_MI = total_H - aleatoric_H           # [B]

            # ── Variance of P(pneumonia) across T ────────────────────────────
            variance = sample_probs[:, :, 1].var(axis=0)   # [B]

            all_mean_preds.extend(mean_probs[:, 1].tolist())
            all_entropy.extend(total_H.tolist())
            all_epistemic.extend(epistemic_MI.tolist())
            all_aleatoric.extend(aleatoric_H.tolist())
            all_variance.extend(variance.tolist())
            all_labels.extend(labels.tolist())
            all_paths.extend(list(paths))
            all_images.extend(images.cpu().unbind(0))

    preds   = (np.array(all_mean_preds) >= 0.5).astype(int)
    correct = (preds == np.array(all_labels)).astype(int)

    results = pd.DataFrame({
        'image_path'        : all_paths,
        'true_label'        : all_labels,
        'mean_pred'         : all_mean_preds,
        'pred_label'        : preds.tolist(),
        'predictive_entropy': all_entropy,
        'epistemic_mi'      : all_epistemic,
        'aleatoric_h'       : all_aleatoric,
        'variance'          : all_variance,
        'correct'           : correct.tolist(),
    })
    return results, all_images


results, test_images = stochastic_inference_mcd(
    model, test_loader, T=T_SAMPLES, device=device
)

print(f'Test samples  : {len(results)}')
print(f'Accuracy      : {results["correct"].mean():.3f}')
print(f'AUC-ROC       : {roc_auc_score(results["true_label"], results["mean_pred"]):.3f}')
🎲 Part 6 — Uncertainty decomposition across the test set
We now analyse how the model decomposes predictive uncertainty on unseen chest X-rays into total, epistemic, and aleatoric components. The following plots show the distribution of uncertainty across the test set, the contribution of each uncertainty type per case, and the relationship between prediction confidence and uncertainty
print('Uncertainty decomposition (mean across test set):')
print(f'  Total entropy  : {results["predictive_entropy"].mean():.4f}')
print(f'  Epistemic (MI) : {results["epistemic_mi"].mean():.4f}')
print(f'  Aleatoric (H)  : {results["aleatoric_h"].mean():.4f}')
# ── Uncertainty decomposition visualisation ───────────────────────────────────

fig, axes = plt.subplots(1, 3, figsize=(15, 4.5))
fig.suptitle('Uncertainty decomposition across the test set', fontsize=13)

# Total entropy
axes[0].hist(results['predictive_entropy'], bins=20,
             color='#534AB7', alpha=0.7, edgecolor='white')
axes[0].set_xlabel('Total uncertainty (entropy)', fontsize=10)
axes[0].set_ylabel('Count', fontsize=10)
axes[0].set_title('Total uncertainty', fontsize=11)
axes[0].spines[['top', 'right']].set_visible(False)

# Epistemic vs aleatoric per case
idx_sorted = results['predictive_entropy'].argsort().values
axes[1].bar(range(len(results)),
            results['epistemic_mi'].values[idx_sorted],
            color='#1D9E75', alpha=0.8, label='Epistemic (MI)')
axes[1].bar(range(len(results)),
            results['aleatoric_h'].values[idx_sorted],
            bottom=results['epistemic_mi'].values[idx_sorted],
            color='#D85A30', alpha=0.8, label='Aleatoric (H)')
axes[1].set_xlabel('Cases sorted by total uncertainty', fontsize=10)
axes[1].set_ylabel('Uncertainty (nats)', fontsize=10)
axes[1].set_title('Epistemic vs aleatoric per case', fontsize=11)
axes[1].legend(fontsize=9)
axes[1].spines[['top', 'right']].set_visible(False)

# Correct vs wrong
correct_mask = results['correct'].astype(bool)
axes[2].scatter(results.loc[correct_mask, 'mean_pred'],
                results.loc[correct_mask, 'predictive_entropy'],
                c='#1D9E75', alpha=0.6, s=30, label='Correct')
axes[2].scatter(results.loc[~correct_mask, 'mean_pred'],
                results.loc[~correct_mask, 'predictive_entropy'],
                c='#D85A30', alpha=0.8, s=55, marker='x', label='Wrong')
axes[2].set_xlabel('Mean P(pneumonia)', fontsize=10)
axes[2].set_ylabel('Predictive entropy', fontsize=10)
axes[2].set_title('Confidence vs uncertainty', fontsize=11)
axes[2].legend(fontsize=9)
axes[2].spines[['top', 'right']].set_visible(False)

plt.tight_layout()
plt.show()

The figure illustrates the uncertainty decomposition obtained from the MC dropout framework on the test set. The left panel shows the distribution of total predictive uncertainty, measured using entropy, across all test samples. The middle panel decomposes the uncertainty for each test case into epistemic uncertainty, representing uncertainty in the model parameters, and aleatoric uncertainty, representing inherent ambiguity or noise in the data. Test cases are sorted by increasing total uncertainty, revealing that aleatoric uncertainty dominates for most samples while epistemic uncertainty remains comparatively small. The right panel relates the model’s predicted probability for the positive class to predictive entropy, highlighting how uncertainty increases for intermediate confidence predictions and decreases for highly confident predictions near 0 or 1, with misclassified cases tending to occur in regions of higher uncertainty.
📊 Part 7 — Clustering certain vs uncertain cases
We split the test set into certain and uncertain groups using the gaussian mixture model, then:
- Compare accuracy and AUC between groups
- Run a Mann-Whitney U test (non-parametric, no normality assumption) to check whether the uncertainty scores of correct and wrong predictions are statistically distinguishable
If MC dropout produces meaningful uncertainty, the uncertain group should have lower accuracy — the model should be less reliable precisely when it says it's unsure.
# Run stochastic inference on validation set
# We use validation entropy distribution to LEARN the uncertainty threshold.
# Then we apply that threshold to the TEST set.

val_results, _ = stochastic_inference_mcd(
    model,
    val_loader,
    T=T_SAMPLES,
    device=device
)

# Fit GMM on VALIDATION entropy

X_val = val_results['predictive_entropy'].values.reshape(-1, 1)

gmm = GaussianMixture(
    n_components=2,
    random_state=42
)

gmm.fit(X_val)

# Find threshold between the two Gaussians

means = gmm.means_.flatten()
means = np.sort(means)

# midpoint between Gaussian means
threshold = means.mean()

print('GMM learned from VALIDATION set')
print(f'Cluster means         : {means}')
print(f'Entropy threshold     : {threshold:.4f}')
# Apply threshold to TEST set

results['uncertainty_group'] = np.where(
    results['predictive_entropy'] > threshold,
    'Uncertain',
    'Certain'
)

certain   = results[results['uncertainty_group'] == 'Certain']
uncertain = results[results['uncertainty_group'] == 'Uncertain']

print()
print(f'Certain group   : {len(certain)} cases')
print(f'Uncertain group : {len(uncertain)} cases')


# Metrics function

def group_metrics(df, name):

    acc = df['correct'].mean()

    auc = (
        roc_auc_score(df['true_label'], df['mean_pred'])
        if df['true_label'].nunique() > 1
        else float('nan')
    )

    mean_ent = df['predictive_entropy'].mean()
    mean_var = df['variance'].mean()

    return {
        'Group'         : name,
        'N Cases'       : len(df),
        'Accuracy'      : acc,
        'AUC-ROC'       : auc,
        'Mean Entropy'  : mean_ent,
        'Mean Variance' : mean_var,
    }


# Compute metrics

certain_metrics   = group_metrics(certain, 'Certain')
uncertain_metrics = group_metrics(uncertain, 'Uncertain')

summary_df = pd.DataFrame([
    certain_metrics,
    uncertain_metrics
])

summary_display = summary_df.copy()

for col in ['Accuracy', 'AUC-ROC', 'Mean Entropy', 'Mean Variance']:
    summary_display[col] = summary_display[col].map(lambda x: f'{x:.4f}')

print('\n📊 Certain vs Uncertain Summary')
display(summary_display)


# Extract values

acc_cert   = certain_metrics['Accuracy']
acc_uncert = uncertain_metrics['Accuracy']

auc_cert   = certain_metrics['AUC-ROC']
auc_uncert = uncertain_metrics['AUC-ROC']


# Mann-Whitney U test (entropy difference between correct vs wrong)

entropy_correct = results.loc[
    results['correct'] == 1,
    'predictive_entropy'
].values

entropy_wrong = results.loc[
    results['correct'] == 0,
    'predictive_entropy'
].values

if len(entropy_wrong) > 0 and len(entropy_correct) > 0:

    stat, p_value = stats.mannwhitneyu(
        entropy_correct,
        entropy_wrong,
        alternative='less'
    )

    print()
    print('📊 Mann-Whitney U test')
    print('H0: entropy(correct) == entropy(wrong)')

    print(f'U statistic : {stat:.2f}')
    print(f'p-value     : {p_value:.4f}')


# Accuracy comparison (z-test)

stat2, p2 = proportions_ztest(
    [
        int(acc_cert * len(certain)),
        int(acc_uncert * len(uncertain))
    ],
    [
        len(certain),
        len(uncertain)
    ]
)

print()
print('📊 Z-test for accuracy difference')
print('H0: accuracy(certain) == accuracy(uncertain)')

print(f'Z statistic : {stat2:.3f}')
print(f'p-value     : {p2:.4f}')

fig, axes = plt.subplots(1, 3, figsize=(16, 4.8))

fig.suptitle(
    'Certain vs Uncertain Groups',
    fontsize=13
)

groups = ['Certain', 'Uncertain']
colors = ['#1D9E75', '#D85A30']


# Accuracy comparison

axes[0].bar(groups, [acc_cert, acc_uncert], color=colors, alpha=0.8, width=0.5)

axes[0].set_ylim(0, 1.05)
axes[0].set_ylabel('Accuracy')
axes[0].set_title('Accuracy by group')

for i, v in enumerate([acc_cert, acc_uncert]):
    axes[0].text(i, v + 0.02, f'{v:.3f}', ha='center', fontsize=11, fontweight='bold')

axes[0].spines[['top', 'right']].set_visible(False)


# AUC comparison (descriptive only)

axes[1].bar(groups, [auc_cert, auc_uncert], color=colors, alpha=0.8, width=0.5)

axes[1].set_ylim(0, 1.05)
axes[1].set_ylabel('AUC-ROC')
axes[1].set_title('AUC by group')

for i, v in enumerate([auc_cert, auc_uncert]):
    axes[1].text(i, v + 0.02, f'{v:.3f}', ha='center', fontsize=11, fontweight='bold')

axes[1].spines[['top', 'right']].set_visible(False)


# Entropy distributions

axes[2].hist(
    certain['predictive_entropy'],
    bins=15,
    alpha=0.6,
    color='#1D9E75',
    edgecolor='white',
    label='Certain'
)

axes[2].hist(
    uncertain['predictive_entropy'],
    bins=15,
    alpha=0.6,
    color='#D85A30',
    edgecolor='white',
    label='Uncertain'
)

axes[2].axvline(
    threshold,
    color='black',
    linestyle='--',
    linewidth=1.5,
    label=f'Threshold = {threshold:.3f}'
)

axes[2].set_xlabel('Predictive entropy')
axes[2].set_ylabel('Count')
axes[2].set_title('Entropy distributions')
axes[2].legend()

axes[2].spines[['top', 'right']].set_visible(False)

plt.tight_layout()
plt.show()

The figure compares model performance between test samples classified as certain and uncertain based on a predictive entropy threshold of 0.378 derived from the variational inference uncertainty estimates. Out of the 100 test cases, 64 samples were categorized as certain and 36 as uncertain. The left panel shows that the model achieves substantially higher accuracy on the certain group (96.9%) compared to the uncertain group (83.3%), while the middle panel demonstrates a similar trend for discrimination performance, with AUC-ROC decreasing from 97.5% in the certain group to 89.1% in the uncertain group. The right panel visualizes the entropy distributions for both groups, where low-entropy samples are concentrated in the certain set and higher-entropy samples dominate the uncertain set, separated by the chosen threshold. Quantitatively, the uncertain group exhibits significantly higher mean predictive entropy (0.5398 vs 0.1719) and predictive variance (0.0319 vs 0.0036), indicating both greater predictive ambiguity and model uncertainty. Statistical analysis further confirms these observations: the Mann–Whitney U test shows a significant difference in entropy distributions between correct and incorrect predictions (p = 0.0036), and the Z-test demonstrates that the accuracy difference between the certain and uncertain groups is statistically significant (p = 0.0166).
🏥 Part 8 — Medical visualization
We present two most certain and two most uncertain cases from the test set
# Visualisation helper

LABEL_NAMES = {0: 'Normal', 1: 'Pneumonia'}

def tensor_to_display(x):

    # take first channel
    img = x[0].numpy()

    # rotate 90° clockwise
    img = np.rot90(img, k=-1)

    # mirror flip (left-right flip)
    img = np.fliplr(img)

    return np.clip(img, 0, 1)


def plot_xray_group(indices, results_df, images_list,
                    group_title, n_show=2):

    indices = list(indices)[:n_show]

    if not indices:
        print(f'No cases to show for: {group_title}')
        return

    fig, axes = plt.subplots(
        1,
        len(indices),
        figsize=(5 * len(indices), 5.5)
    )

    if len(indices) == 1:
        axes = [axes]

    fig.suptitle(
        group_title,
        fontsize=13,
        fontweight='bold',
        y=1.02
    )

    for ax, idx in zip(axes, indices):

        row = results_df.loc[idx]

        # now rotated + mirrored
        img = tensor_to_display(images_list[idx])

        ax.imshow(img, cmap='gray')
        ax.axis('off')

        true_name = LABEL_NAMES[int(row['true_label'])]
        pred_name = LABEL_NAMES[int(row['pred_label'])]

        verdict = '✓ Correct' if row['correct'] else '✗ Wrong'

        color = '#1D9E75' if row['correct'] else '#D85A30'

        title = (
            f'{verdict}\n'
            f'True: {true_name}\n'
            f'Pred: {pred_name} ({row["mean_pred"]:.2f})\n'
            f'Entropy: {row["predictive_entropy"]:.4f}\n'
            f'Variance: {row["variance"]:.5f}'
        )

        ax.set_title(
            title,
            fontsize=9,
            color=color,
            pad=5
        )

    plt.tight_layout()
    plt.show()
# MOST CERTAIN CASES

most_certain_idx = (
    certain
    .nsmallest(2, 'predictive_entropy')
    .index.tolist()
)

plot_xray_group(
    most_certain_idx,
    results,
    test_images,
    '🟢 Most Certain Cases'
)

# MOST UNCERTAIN CASES

most_uncertain_idx = (
    uncertain
    .nlargest(2, 'predictive_entropy')
    .index.tolist()
)

plot_xray_group(
    most_uncertain_idx,
    results,
    test_images,
    '🔴 Most Uncertain Cases'
)

💾 Part 9 — Save results
results['method'] = 'MC_Dropout'

save_path = '/kaggle/working/results_md.csv'
results.to_csv(save_path, index=False)

print(f'Results saved to: {save_path}')
✅ Session summary
| Step | What we did |
|---|---|
| 🗂️ Data | Subsampled with class ratios (normal:pneu = 2.7:1 train, 1.7:1 test) |
| 🧠 Model | Standard DenseNet121 + nn.Dropout(0.3) — no new library components |
| ⚙️ Training | Plain cross-entropy — zero training overhead vs a standard model |
| 🔧 Inference | enable_dropout() fixes BatchNorm + keeps Dropout active for T passes |
| 🧩 Decomposition | Total = Epistemic (MI) + Aleatoric (expected H) — per image |
| 🏥 Visualization | Most Certain and Most Uncertain cases |
➡️ Next: Session 9: Deep Ensembles
Session 9 introduces Deep Ensembles — a method that makes no Bayesian claims at all, yet consistently outperforms both VI and MC Dropout on calibration benchmarks. The lesson it teaches about the gap between theory and practice is one of the most important in the course.